
You Don't Understand A System Until You Can Draw It
And neither does your team.

Words allow you to be vague about how things connect. Diagrams force you to confront relationships, dependencies, structures. When you draw together, organisations discover what they actually believe about how things work.
Those diagrams become something more than meeting notes. They’re railway tracks that guide how others think about the system long after you’ve left the room.
I discovered this because I can’t think any other way. I have aphantasia — no pictures in my head. Every system must be externalised to work with it. And that’s how I learned drawing isn’t for sharing what you know. It’s how you figure out how things actually connect.
Why Drawing Is Thinking
The Gap Between Knowing And Understanding
Writing forces clarity. So does drawing. You don’t realise you don’t understand a system until you try to draw it: boxes on paper, arrows connecting them, relationships labelled.
There’s a well-replicated effect: argue the opposite of a belief and your conviction drops. Not because the other side wins, but because you expose gaps in your own model. Drawing does the same to system beliefs.
My mentor asked me to draw the uSwitch business model. I had abstractions in my head (relationships, flows, dependencies) but tried to translate them into something concrete. I drew literally. Customers on one side, suppliers on the other, our platform connecting them, regulations surrounding everything. All the components.
He looked at my drawing. “Draw what’s actually in your head. Draw the abstractions.”
Customer needs. Supplier relationships. Regulation. Platform capabilities. 4 core elements that applied across all our verticals: energy, broadband, insurance, mortgages. Not the concrete components, but the pattern underneath.

His abstraction revealed the next level. Not just how one marketplace works, but how multiple marketplaces working together create pull and tension across the whole system.
That moment gave me permission. I didn’t need to translate abstractions into concrete things. I could draw what was actually in my head: the patterns, the relationships, the structures.
Collaborative Drawing Is Collaborative Thinking
Draw alone, work out your understanding. Draw with others, work out shared understanding.
People nod along to words for hours, each building different mental models. Nobody knows they disagree until decisions reveal disconnects.
Start sketching. Disagreements surface immediately. Someone points: “That’s not how it works.” Another adds a box: “You’re missing this.” The diagram forces reconciliation.
The philosopher Isaiah Berlin described 2 types of thinkers: hedgehogs who know one thing deeply, and foxes who connect across domains. Both exist in every organisation.
Hedgehogs see the system beyond their domain. Foxes ground abstraction in concrete reality. Words let hedgehogs and foxes talk past each other. Diagrams make them meet.
That uSwitch abstraction (customer needs, supplier relationships, regulation, platform capabilities) balances 4 interdependent dimensions in parallel. Most people can’t hold all 4 simultaneously. They think sequentially, losing connections.
Diagrams make parallel thinking possible. All 4 dimensions visible. Connections explicit. Trade-offs clear. Collaborative thinking. Working out how the system actually works together because you can’t hold it in your heads alone.
Railway Tracks Persist
The drawings outlive the meeting.
Months and years later, I see my sketches (or an evolved version) in presentations. The ideas scribbled on a page travel on their own. People draw the same picture back when explaining how the system works to others.

My mentor calls that the magic moment: when people can externalise the model themselves, alignment has happened. Not whether they can explain in words, but whether they’ve internalised the system enough to draw it independently.
The thinking happened collaboratively through drawing. The diagrams persist as infrastructure.
How It Evolved
Solo Drawing: Working Out My Own Understanding
Those early sketches taught me: abstractions on paper reveal what you understand versus what you think you understand.
I started using this deliberately. 2-sided marketplace diagrams. Platform architecture. Team structures. Roadmaps. Every complex system, I drew first. Not to communicate it, but to figure out how it actually worked.

Collaborative Drawing: Working Out Shared Understanding
I used this approach at my previous job and brought it to loveholidays. Not just technical systems but everything.
When I took responsibility for our contact centre, it lacked clarity. Nobody could articulate how teams connected, where responsibilities overlapped, what happened when customer issues moved through the system.
Drawing forced decisions. Where do handoffs happen? Who owns what? How does information flow?
The diagram didn’t communicate existing structure. It created structure. We didn’t know how the system worked until we drew it together.
This works beyond tech. Complex systems defeat conversation alone.
Scrumpled Paper Moments

Session ends. Paper covered with boxes, arrows, annotations. Spaghetti. I’m about to bin it.
“Can you send me that?”
Those connections are in my head now, but others need them. Maybe seeing these concepts externalised for the first time.
The diagram captured the collaborative thinking process. Now it guides how others think about the same system.
Systematising: From Co-Creation to Infrastructure
Sketches on paper only scale so far. Co-creation in a room works if you think in systems and you’re in the room working it out together.
But rough sketches fail for people who don’t naturally think systemically. And they fail for anyone who wasn’t in the room during co-creation.
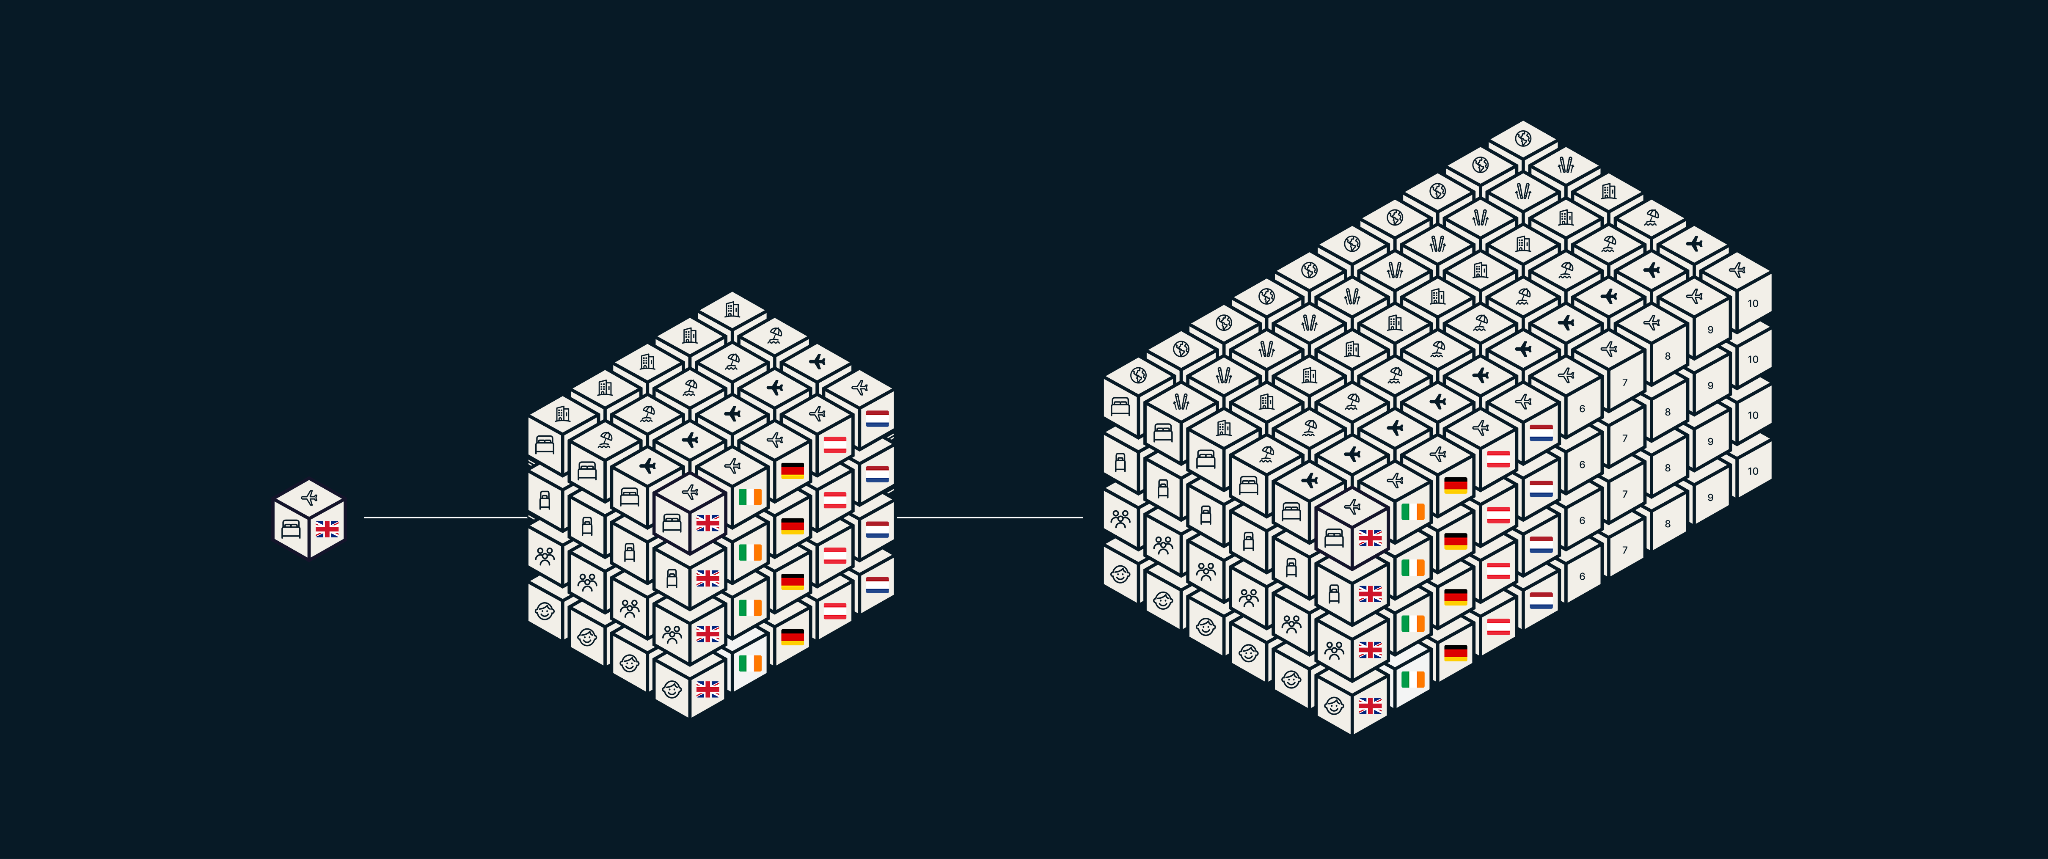
Recently I tried to understand the complexity of scaling into 160 markets. Each has different regulations, currencies, customer expectations, partner relationships. I created my usual rough sketch, working out how this scaling actually worked, then co-creating with the team. We aligned. We understood the structure together.
When I shared it wider, people didn’t quite get it. Some couldn’t follow the rough sketch because they don’t think in systems. Others weren’t in the room when we’d worked it out, so they lacked the context.
Jazz, our Design Manager, took it and transformed it. Same structure, systematically designed so anyone could understand the complexity immediately. Regardless of how they think or whether they were there.
People saw Jazz’s version and said, “Brilliant.” It went from working in the room to working across the organisation. From co-created understanding to organisational infrastructure.
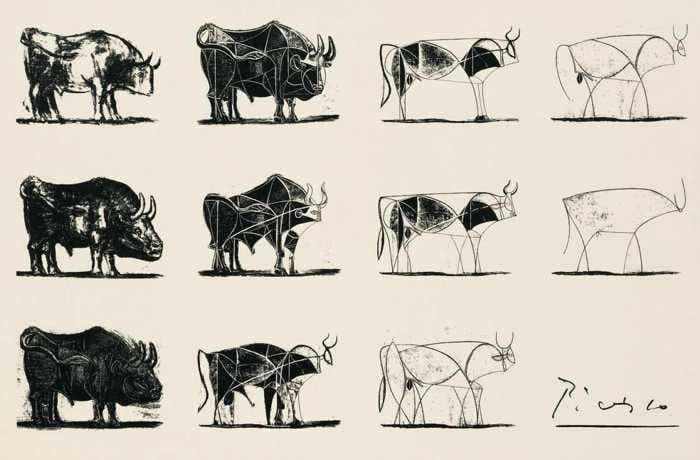
It’s like Picasso’s bull studies: each iteration reduces to essential lines until the final version captures the essence in a few strokes. The studies work out the abstraction. The artwork makes it instantly legible.
Jazz didn’t make it prettier. She made it portable.
Rough sketches work out system understanding in the room, with people who think systemically. Systematic design turns that understanding into infrastructure that works for everyone, everywhere. Both serve thinking at different stages.
Why This Matters Now
Systems are getting more complex, and the way we work with them is changing.
A few months ago I sat with one of our content managers. She was talking about how we scaled hotel content with AI. 3 people kept 2,000 hotels updated each year but this changed to 50,000+ in 3 languages.
She’d been thinking in systems but she had to encode them into prompts and words.
You could no longer see the system: its steps, decision points, exceptions, branches, feedback loops.
A few months later this pattern is being replicated on a number of different teams. However, we’re using n8n at loveholidays to design and visualise these workflows. The tool lets you work out how systems should function by drawing the structure, seeing where decisions branch, where loops feed back. Then those visual workflows drive the AI execution.
.png")
The progression: from seeing systems and encoding into prompts to designing workflows visually that make the system structure explicit.
AI handles execution. Someone still designs the system.
As AI advances, visual thinking doesn’t get less important. It becomes essential. Systems are more complex. Drawing is how you work out that complexity, alone and together.
What You Can Use
You don’t need aphantasia.
Be the person who draws. Lean into the awkwardness even if you don’t know where to start. You don’t know how a system works until you externalise it.
Next time people describe a system in a meeting, notice if they’re working out how it actually works or talking past each other. Grab a whiteboard.
Don’t worry about pretty. Boxes and arrows work. Roughness signals “we’re working this out together.” People feel comfortable adding, questioning, changing.
When people ask “can you send that?”, do it. Those diagrams become railway tracks, infrastructure for how your organisation understands systems.
When they draw it back. That’s when you’re aligned.
Need to scale that understanding beyond the room, beyond systems thinkers? Invest in systematic design. Get an artist like Jazz to help. Rough for working it out. Designed for making it portable.
The goal isn’t beautiful diagrams. It’s thinking infrastructure. Rail tracks that guide how your organisation works out system complexity together.
The Advantage
I can’t picture things in my head, so everyone sees how I understand systems. Not finished thoughts, but the process of working them out.
No private knowledge. No hidden images. Just collaborative understanding that becomes shared infrastructure.
In a world where AI handles execution and competitive advantage shifts to systems thinking, the inability to think privately isn’t a limitation.
It’s a feature.
It’s exactly what’s needed.
Thanks for using our n8n workflow as an example. 🤗 - good article Mike
Creating shared understanding is the grand prize! Love the article and motivates me to do this more often - and maybe even by default!