
How We Prove Our Tech Transformation Works (with 6 Years of Evidence + AI)
Disciplined data collection turned boardroom confrontations into predictive intelligence


"What do you mean we should report outcomes, not the number of tests!?"
This mid-board presentation challenge caught me off guard. I'd thought measuring outcomes rather than activity was obvious. But the ensuing 10-minute roasting was a great reminder that technology transformations always require proof, not just opinion.
It left me even more determined to prove the impact—if there was pushback on the basics, I would need bulletproof evidence for the controversial stuff.
What followed was six years of disciplined measurement covering everything from engagement, engineering velocity, system reliability, and cost attribution. It has created a foundation for proving transformation actually works and has now been supercharged by AI.
Here's how that obsession with proof transformed not just our metrics, but our entire approach to change.
Why Measurement Became An Insurance Policy
The transformations at my previous companies had been remarkable successes. We'd relentlessly focused on business metrics—revenue grew, conversion rates improved, customer acquisition costs dropped. But whenever I tried to explain the role our technology changes had played, I kept hearing the same question: "But can you prove it was down to the tech changes?"
I thought it was obvious. We'd rebuilt the architecture, improved deployment processes, and invested heavily in platform reliability. The correlation seemed clear to me. But without hard data connecting our technical improvements to business outcomes, all I had were compelling stories and architectural diagrams. Anecdotes, not evidence.
It was frustrating because I knew the technology transformation had been fundamental to our success. But "knowing" and "proving" are very different things, especially to stakeholders who don't live in the technical details every day.
This experience taught me that having the best technology transformation in the world means nothing if you can't demonstrate its impact. So when I joined loveholidays, I was determined to build that proof alongside the transformation itself.
The Discipline That Built Our Data Foundation
The challenge was that loveholidays had no focus on technical or cultural metrics. But I came prepared this time. I'd read extensively about this challenge and the research was compelling: DORA showed elite performers are 2.5x more profitable and deploy 208x more frequently, Gallup proved engaged teams deliver 23% better results, and "How Google Works" reinforced the importance of psychological safety for high-performing teams.
The research didn't just show me why measurement mattered—it guided what to measure. DORA provided the technical metrics (deployment frequency, lead times), while Spotify's team health check gave me a framework for cultural measurement. Not only would this be a way to talk about our success, but a mechanism to build confidence without relying on "just trust me."
Like most things in a scale-up business, it was a chance to put something in place to make a difference in the medium to long term.
Phase 1: Manual Beginnings (2019-2022)
We started small and focused with team health surveys—just a Google Form that I manually transferred to a spreadsheet each quarter. But reading every comment about the impact of our changes made the effort worthwhile.
We applied the same scrappy approach to technology metrics: website speed, incident tracking, cost, and deployments. Each process was as hacky as the other, but we finally had visibility into our performance.
This early discipline helped solve something I'd written about in Agile needs a story—incremental improvements often go unnoticed without 'Big Bang' moments to celebrate. But having data did more than demonstrate our transformation was working; it gave us the motivation to keep going. What gets measured gets managed, and seeing deployment frequency increasing, incident resolution times dropping, and team satisfaction scores rising created momentum for the harder changes ahead.
Those quarterly surveys and scrappy tracking became our validation system, building evidence that our strategy was on the right track while giving us motivation to tackle the harder changes ahead.
Phase 2: Data Products and Individual Wins (2022-2024)
The momentum from Phase 1 continued as we looked to expand what we tracked and standardise our approach. We'd been investing in a data mesh for our business and decided to treat this performance data with the same care, transforming these disparate datasets into proper data products.
Standardising access through BigQuery-to-Google Sheets connections was a game-changer—suddenly teams could easily link performance data to their OKRs.
What started as my personal obsession became loveholidays' measurement template. Teams started using health data as key results to improve how they worked, and our engineering culture metrics influenced company-wide engagement surveys.
It was satisfying to watch the technology transformation play out in these metrics: financially through millions saved via cost attribution, customer experience by outperforming Google on 2 out of 3 Core Web Vitals, and quality of life for developers with fewer PagerDuty calls and faster incident resolution. Each metric delivered value independently, showing that disciplined measurement works even when optimising in isolation.
We used these metrics to demonstrate progress in board meetings—perhaps most satisfyingly when we showed how we were decoupling growth from engineering headcount by measuring the effectiveness of commercial teams making changes without developer effort.
Metrics We Track
After years of refinement and millions of data points, here's our current list of data products we use to track our performance. Each metric is selected because of it’s predictive power on business outcomes or correlates with team performance:
🧠 Team Health
Team Health Check (Google Forms, Quarterly) – 14 product team questions
Employee Engagement (Google Forms, Monthly) – Broader engagement metrics
OKR Performance & Progress (ClickUp, Weekly) – Indicates outcome delivery
⚙️ Engineering Velocity
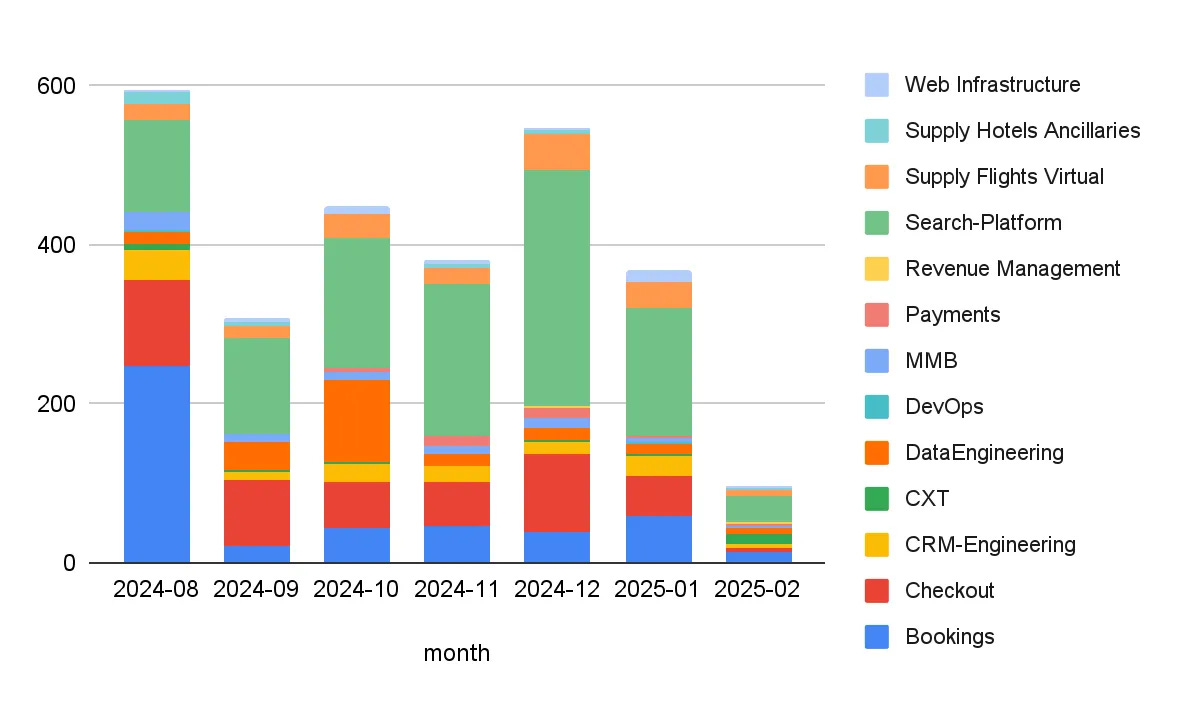
Deployment Frequency (GitHub, Per deployment) – 300k+ tracked
Build Times (GitHub Actions, Per build) – 647k+ builds tracked
Lead Time for Deployment (GitHub, Per deployment) – Reduced from 4.6hrs to 37min
Pull Request Metrics (GitHub, Per PR) – Review cycle analysis
Git Commits & Activity (GitHub, Per commit) – Development velocity
🔧 System Reliability
Incidents Tracking (incident.io, Per incident) – 1,342 incidents tracked
Error Counts & Patterns (Sentry, Daily) – 596M+ errors tracked
PagerDuty Incidents (PagerDuty API, Per alert) – Monitors on-call load
On-Call Hours & Distribution (PagerDuty API, Monthly) – Team burden analysis
🌍 Web Performance
Core Web Vitals (Rudderstack, Continuous) – LCP, FID, CLS, TTFB
Application Performance (Linkerd, Daily) – Latency, throughput, success rates
💸 Infrastructure
Kubernetes Cost Attribution (GCP Billing, Daily) – Team & app-level cost tracking
Cloud Infrastructure Costs (GCP Billing, Daily) – Infrastructure spend analysis
This list is still evolving though and we are currently rebuilding cost attribution and plan to add team composition metrics over time too.
AI-Powered Insights: An Overnight Success 6 Years in the Making
With all this data systematically collected over six years, something remarkable became possible. Our BOOST team spent a weekend figuring out MCP integration with Claude, connecting our data mesh to conversational AI.
The first time they showed me what was possible, it blew my mind. I kept showing people around the company, even presenting it as an example of how AI could transform our business at the company's all-hands (and posting on linkedin).
Six years of disciplined data collection suddenly became conversational. We can now ask, "What makes our best teams most effective?" and get instant correlation analysis that would have taken weeks to compile manually.
We're now in a position to understand which improvements truly drive the outcomes that matter most. Instead of optimising metrics in isolation, we can ask: "Which changes correlate with our biggest business wins?"
This isn't AI doing the thinking for us—it's helping us surface patterns we couldn't previously see in time to act on them.
We're just at the beginning of this capability, but the foundation is solid.
The Foundation That Unlocks Possibilities
The measurement obsession that began with a 10-minute boardroom roasting taught me that breakthroughs don't come from new tools—they come from amplifying the work you've quietly invested in for years.
Three lessons stood out from our six-year journey:
Measure from day one - build proof alongside your transformation as you can't retrofit proof after the fact
Treat performance metrics like business metrics - make them visible, easy to access, and therefore manageable
Committing to the long haul pays off because data becomes exponentially more valuable the longer you keep it
When I talk about loveholidays now, I don't just have stories about improvements—I have data to support them. Our lead time dropped from 4.6 hours to 37 minutes, teams with high psychological safety deliver 40% faster code reviews, and we've saved millions in infrastructure costs. Even cooler, we can now ask Claude which changes correlate with our biggest business wins and get instant answers.
What are you doing for your teams that you can't currently prove works? What boring, consistent measurement could you start this week that might transform how your organisation operates in six years?